
Skjold Oil and Gas Field (Denmark)
From Global Energy Monitor
| This article is part of the Global Oil and Gas Extraction Tracker, a Global Energy Monitor project. |
| Related categories: |
Skjold Oil and Gas Field is an operating oil and gas field in Denmark.
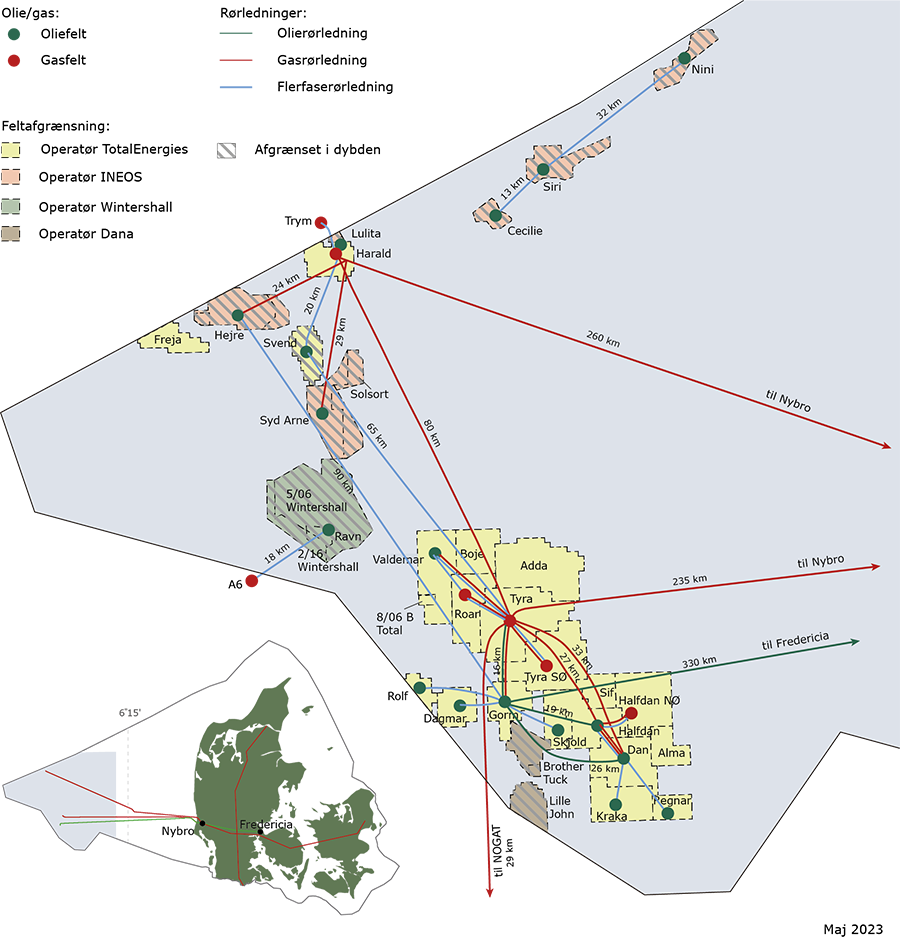
Along with Gorm Oil and Gas Field (Denmark) and Rolf Oil and Gas Field (Denmark), Skjold Oil and Gas Field is a part of the Gorm complex.
Project Details
Main Data
Table 1: Field-level project details for Skjold Oil and Gas Field
| Unit name | Status | Operator | Owner | Discovery year | FID1 year | Production start year | Production type |
|---|---|---|---|---|---|---|---|
| Skjold | Operating[1] | INEOS[2] | INEOS (65.0%); Danoil Exploration A/S (15.0%); Nordsøfonden (20.0%)[3] | 1977[4] | – | 1982[5] | Conventional[6] |
Production and Reserves
Table 2: Reserves of Skjold Oil and Gas Field
| Fuel description | Reserves classification | Quantity | Units | Data year | Source |
|---|---|---|---|---|---|
| liquids | 2P reserves | 30.9 | million bbl | 2022 | [7] |
| oil | reserves | 18.87 | million bbl | 2018 | [8] |
| sales gas | reserves | 0 | million m³ | 2018 | [8] |
Table 3: Production from Skjold Oil and Gas Field
| Category | Fuel description | Quantity | Units | Data year | Source |
|---|---|---|---|---|---|
| cumulative production | gas | 4025.88 | million m³ | 2014 | [9] |
| cumulative production | gas | 4094.45 | million m³ | 2015 | [10] |
| cumulative production | gas | 4342.38 | million m³ | 2019 | [5] |
| cumulative production | oil | 289.09 | million bbl | 2014 | [9] |
| cumulative production | oil | 292.33 | million bbl | 2015 | [10] |
| cumulative production | oil | 303.99 | million bbl | 2019 | [5] |
| cumulative production | oil | 311.03 | million bbl | 2022 | [1] |
| cumulative production | gas | 4462.65 | million m³ | 2022 | [1] |
| production | gas | 51.7 | million m³/y | 2019 | [5] |
| production | oil | 2.59 | million bbl/y | 2019 | [5] |
| production | oil | 2.61 | million bbl/y | 2022 | [1] |
| production | oil | 2.2 | million bbl/y | 2021 | [1] |
| production | oil | 2.25 | million bbl/y | 2020 | [1] |
| production | gas | 48.53 | million m³/y | 2022 | [1] |
| production | gas | 35.87 | million m³/y | 2021 | [1] |
| production | gas | 35.87 | million m³/y | 2020 | [1] |
Location
Table 4: Field-level location details for Skjold Oil and Gas Field
| Concession/Block | Location | Onshore/Offshore | Coordinates (WGS 84) |
|---|---|---|---|
| 5504/16[11] | Offshore, Denmark[12] | Offshore[13] | 55.5341, 4.9049 (exact)[12] |
The map below shows the exact location of the field(s) within the Gorm complex:
Articles and Resources
Additional Data
To access additional data, including an interactive map of oil and gas extraction sites, a downloadable dataset, and summary data, please visit the Global Oil and Gas Extraction Tracker on the Global Energy Monitor website.
References
- ↑ 1.0 1.1 1.2 1.3 1.4 1.5 1.6 1.7 1.8 "2022 Annual Production". Danish Energy Agency. 44792. Archived from the original on August 16 2023. Retrieved August 15 2023.
{{cite web}}: Check date values in:|access-date=,|date=, and|archive-date=(help) - ↑ https://web.archive.org/web/20230522165656/https://ens.dk/sites/ens.dk/files/OlieGas/anlaeg_felter_eft-tilladelser_i_nordsoen_2023_eng.png. Archived from the original on 22 May 2023.
{{cite web}}: Missing or empty|title=(help) - ↑ "Danish Licences and Licensees". Danish Energy Agency. Archived from the original on August 17, 2023. Retrieved August 17, 2023.
- ↑ https://web.archive.org/web/20210802013600/https://www.wiki.total/en/country/total-denmark. Archived from the original on 02 August 2021.
{{cite web}}: Check date values in:|archive-date=(help); Missing or empty|title=(help) - ↑ 5.0 5.1 5.2 5.3 5.4 "Monthly and yearly production". Danish Energy Agency. 2021. Archived from the original on April 13, 2021. Retrieved April 13, 2021.
- ↑ https://web.archive.org/web/20230601183305/https://www.velaw.com/shale-fracking-tracker/resources/denmark/. Archived from the original on 01 June 2023.
{{cite web}}: Check date values in:|archive-date=(help); Missing or empty|title=(help) - ↑ BlueNord (2023). "Annual Statement of Reserves and Resources Year End 2022" (PDF). Cision. Archived (PDF) from the original on August 16 2023. Retrieved August 16 2023.
{{cite web}}: Check date values in:|access-date=and|archive-date=(help) - ↑ 8.0 8.1 (PDF) https://web.archive.org/web/20230314032541/http://ens.dk/sites/ens.dk/files/OlieGas/ressourcer_og_prognoser_20180829_rev_en.pdf. Archived from the original (PDF) on 14 March 2023.
{{cite web}}: Missing or empty|title=(help) - ↑ 9.0 9.1 (PDF) https://web.archive.org/web/20230128063417/http://ens.dk/sites/ens.dk/files/OlieGas/oil_and_gas_in_denmark_2014_.pdf. Archived from the original (PDF) on 28 January 2023.
{{cite web}}: Missing or empty|title=(help) - ↑ 10.0 10.1 (PDF) https://web.archive.org/web/20230316124310/http://ens.dk/sites/ens.dk/files/OlieGas/produktion_uk.pdf. Archived from the original (PDF) on 16 March 2023.
{{cite web}}: Missing or empty|title=(help) - ↑ "Shape file with Offshore Installations". Danish Energy Agency. Archived from the original on August 16 2023. Retrieved August 16 2023.
{{cite web}}: Check date values in:|access-date=and|archive-date=(help) - ↑ 12.0 12.1 "Shape Files on Oil and Gas for Maps". Danish Energy Agency. 2020. Archived from the original on April 13, 2021. Retrieved April 13, 2021.
- ↑ Natural Earth. 45078 https://www.naturalearthdata.com/downloads/10m-physical-vectors/10m-ocean/. Archived from the original on June 29, 2023. Retrieved June 29, 2023.
{{cite web}}: Check date values in:|date=(help); Missing or empty|title=(help)